As you begin to divide conglomerate functionality into discrete, decoupled microservices, you introduce a number of opportunities and challenges into your system(s). The opportunities are often well-known, including (and especially!) development velocity, fidelity/fit (functionality matches requirements), scalability, and a host of other “ilities”.
Challenges also exist of course, including the question of how to gain visibility into end-to-end interactions involving multiple microservices across process and network boundaries. Spring Cloud Sleuth provides a lightweight, configurable, and easy way to begin capturing trace information within your distributed system.
Distributed tracing: a (very) high-level overview
Briefly, an entire end-to-end interaction that completes a request cycle (regardless of transport/mechanism) is referred to as a “trace”, and each trace consists of multiple “spans” connecting the endpoints of each hop. From the
Spring Cloud Sleuth project page:
A Span is the basic unit of work. For example, sending an RPC is a new span, as is sending a response to an RPC. Span’s are identified by a unique 64-bit ID for the span and another 64-bit ID for the trace the span is a part of. Spans also have other data, such as descriptions, key-value annotations, the ID of the span that caused them, and process ID’s (normally IP address). Spans are started and stopped, and they keep track of their timing information. Once you create a span, you must stop it at some point in the future. A set of spans forming a tree-like structure called a Trace. For example, if you are running a distributed big-data store, a trace might be formed by a put request.
Sometimes within the Spring space, you hear about Sleuth and Zipkin within the same discussion, often within the same breath…which understandably can result in a bit of confusion on the listener’s part. Without diving too far down the rabbit hole, Sleuth provides the means to instrument your Spring Boot/Spring Cloud applications; Zipkin can take that data and provide a means to monitor and evaluate it. Zipkin provides numerous integrations, but of course, you can also use other log monitoring & management tools to collect and analyze that vital data.
Minimum Viable Product
This post focuses upon Sleuth and provides a quick on-ramp to getting started capturing basic information for each span. To do that, I’ve created
these two projects that allow us to quickly add trace & span (& more) information to our interactions and verify it in our logs.
Creating a provider service
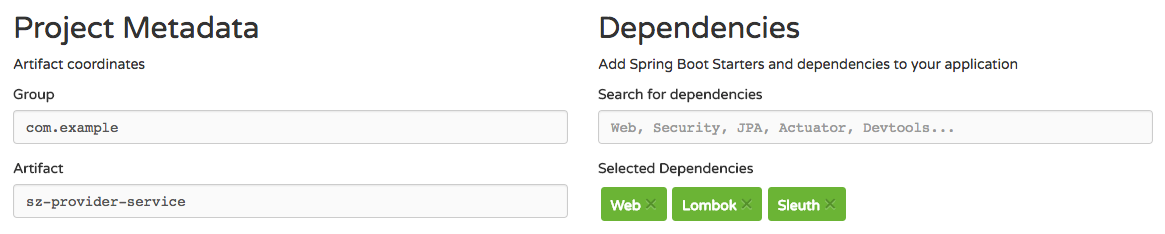
Starting at the
Spring Initializr, I added the following dependencies to a project and named the artifact
sz-provider-service:
(click/tap to enlarge)
After generating the project and downloading, extracting, and opening it in our IDE, we see the selected dependencies in our Maven pom:
Or if using Gradle, build.gradle:
To provide better context within our logs for our tracing data, we’ll add the following entry to our application.properties file:
spring.application.name=sz-provider-service
For this example, we’ll create a very simple RestController so we have something in our provider microservice to contact from a consumer service. Here is the entirety of the relevant code:
The only thing of particular note is the @Log statement. Lombok provides this capability to reduce the usual boilerplate code required to get a logger via LogFactory.
Creating a consumer service
For the purpose of this introduction, little changes between provider and consumer project configuration & code. Here are the exceptions:
- Revisiting the Spring Initializr, we change the artifact name to sz-consumer-service, keeping the same dependencies
- We add the following entries to our consumer microservice’s application.properties file:
spring.application.name=sz-consumer-service
server.port=8081
NOTE: We’re running the provider on port 8080 (Tomcat’s default port), so we change our consumer service’s port to 8081 to avoid conflict.
- This is the code for our consumer:
The same note about Lombok’s @Log applies here as well, of course.
The results
Running the two applications, we can now access the consumer’s endpoint from httpie, cURL, or a browser:
Doing so results in the following log entries from our consumer service:
And our provider service:
Examining our log entries for both services (above), we see that Spring Cloud Sleuth has placed our spring.application.name (as designated in each service’s application.properties), the appropriate trace id, and the span id specific to this hop within the logged information.
Summary
Of course, Sleuth captures much more data and allows for extensive customization (including enabling additional elements you specify to be captured, adjusting sampling rates, & more), and Zipkin remains a topic for another day. But this post should have provided a quick springboard (!) into using Spring Cloud Sleuth for better insight into your microservices-based system of systems.
Happy Sleuthing!
Additional information
Related Posts:
Tags: Dapper,
java,
Sleuth,
span,
Spring,
Spring Boot,
Spring Cloud,
Spring Cloud Sleuth,
Spring Framework,
trace,
tracing,
Zipkin